Why is air pollution a major public health problem?
WHO counts air pollution among the largest environmental threats to health. In 2019, 99% of the world's population lived in places where WHO air quality guideline levels were not met. Ambient (outdoor) air pollution caused an estimated 4.2 million premature deaths worldwide in 2019, and the combined effects of ambient and household air pollution are associated with 6.7 million premature deaths a year.
| Cause of death | Share |
|---|---|
| Ischaemic heart disease and stroke | 68% |
| Chronic obstructive pulmonary disease | 14% |
| Acute lower respiratory infections | 14% |
| Lung cancer | 4% |
What are the major air pollutants and their health effects?
Pollutants are classed as primary (emitted directly — sulphur dioxide, nitrogen oxides, carbon monoxide, particles, lead) or secondary (formed in air — ozone and peroxyacetyl nitrate in photochemical smog). Fine particulate matter is the main driver of the cardiovascular, respiratory and cancer deaths attributed to outdoor air.
| Pollutant | Main sources | Key health effect |
|---|---|---|
| PM2.5 and PM10 | Combustion of fuels, vehicles, industry, dust | Cardiovascular and respiratory disease, lung cancer; PM2.5 penetrates deep into the lungs |
| Sulphur dioxide (SO2) | Fossil fuel burning, industry | Higher risk in lung disease, the elderly and children; acid rain; core of London-type smog |
| Nitrogen dioxide (NO2) | Vehicle exhaust, power stations | Long-term exposure linked to chronic lung disease; eye, nose and throat irritation; precursor of photochemical smog |
| Carbon monoxide (CO) | Incomplete combustion | Binds haemoglobin far more avidly than oxygen, causing tissue hypoxia |
| Ozone (O3) | Secondary, from NOx and volatile organic compounds in sunlight | Strong oxidant; key component of photochemical smog |
| Lead (Pb) | Metal and ore processing, batteries, waste incinerators, some petrol engines | Neurotoxicant — learning disability, memory impairment and hyperactivity in children |
What are the types of smog?
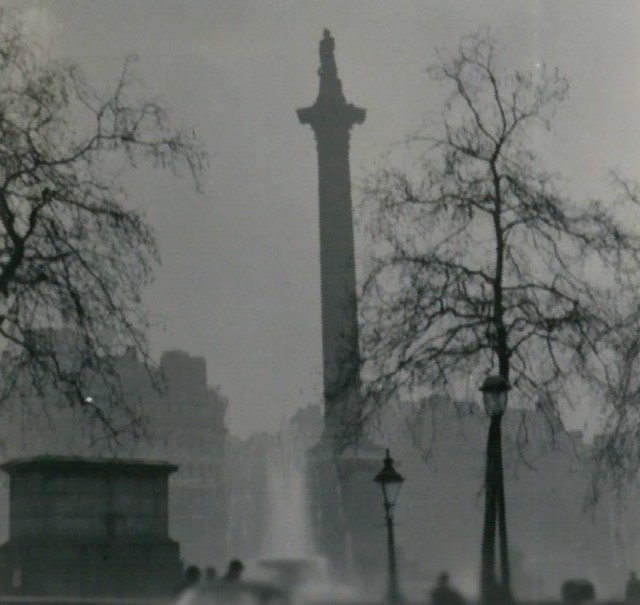
The word smog was coined from smoke + fog to describe the low-level pollution covering London in the early twentieth century. Three forms are described: acidic (London) smog, photochemical (Los Angeles) smog and Polish smog. Exams ask you to contrast the first two.
Weather decides which type forms. Acidic smog builds up when air pressure is low and the temperature stays only a few degrees above zero, so pollutants concentrate near the ground; Polish smog arises in the frosty season under high pressure. Photochemical smog needs strong sunlight and temperatures above roughly 28 to 30 °C, which is why it is a summer problem where vehicle emissions are heavy.
| Feature | Acidic (London) smog | Photochemical (Los Angeles) smog |
|---|---|---|
| Season | Winter (November to January) | Summer |
| Weather | Low temperature, high humidity, low pressure | Intense sunlight, high temperature |
| Source | Combustion of coal, oil and gas | Nitrogen oxides from vehicles and power plants plus volatile organic compounds |
| Main components | Oxides of sulphur, nitrogen and carbon, carbon black, suspended particles | Nitrogen oxides, ozone, volatile hydrocarbons, carbon monoxide; PAN |
| Appearance | Grey, smoky fog | Brown haze |
| Classic episode | London, December 1952 — about 4,000 deaths | Los Angeles |

What are the indicators of air pollution?
An indicator is a measured quantity used to judge how polluted the air is. Older surveillance relied on sulphur dioxide and smoke (black smoke) readings; modern Indian monitoring relies on a defined set of pollutants with legally notified limits and on particulate matter above all.
- Smoke (soiling) index — air is drawn through white filter paper and the darkness of the stain left by smoke particles is measured; the British method expressed it as 'black smoke'. A similar reflectance-based method expressed the stain as the coefficient of haze.
- Sulphur dioxide — the classic marker of coal and oil burning; the core gas of London-type smog.
- Particulate matter — PM10 and PM2.5, now the primary indicators; India's AQI cannot be calculated unless PM10 or PM2.5 is one of the pollutants measured.
- Gaseous pollutants — NO2, CO, O3 and NH3, plus lead and other trace pollutants in the national standards.
What are India's National Ambient Air Quality Standards?
The Central Pollution Control Board notified the National Ambient Air Quality Standards (NAAQS) on 18 November 2009 under the Air (Prevention and Control of Pollution) Act, 1981, replacing the 1994 and 1998 notifications. They set limits for 12 pollutants, separately for industrial, residential, rural and other areas and for ecologically sensitive areas.
| Pollutant | Annual average | 24-hour (or shorter) limit |
|---|---|---|
| Sulphur dioxide | 50 (20 in ecologically sensitive areas) | 80 (24 h) |
| Nitrogen dioxide | 40 (30 in ecologically sensitive areas) | 80 (24 h) |
| PM10 | 60 | 100 (24 h) |
| PM2.5 | 40 | 60 (24 h) |
| Ozone | — | 100 (8 h); 180 (1 h) |
| Lead | 0.5 | 1.0 (24 h) |
| Carbon monoxide (mg/m³) | — | 2 (8 h); 4 (1 h) |
| Ammonia | 100 | 400 (24 h) |
| Benzene | 5 | — |
| Benzo(a)pyrene (ng/m³) | 1 | — |
| Arsenic (ng/m³) | 6 | — |
| Nickel (ng/m³) | 20 | — |
The annual figure is the arithmetic mean of at least 104 measurements a year, taken twice a week, 24-hourly. Short-term limits must be met 98% of the time; they may be exceeded on 2% of days, but not on two consecutive monitoring days.
How is India's National Air Quality Index calculated?
The National Air Quality Index (AQI) turns complex monitoring data into a single number, a name and a colour. It uses eight pollutants — PM10, PM2.5, NO2, SO2, CO, O3, NH3 and lead — for which short-term national standards exist. A sub-index is calculated for each pollutant from its concentration, and the worst sub-index becomes the AQI for that location.
| AQI category | AQI range | PM10 | PM2.5 |
|---|---|---|---|
| Good | 0–50 | 0–50 | 0–30 |
| Satisfactory | 51–100 | 51–100 | 31–60 |
| Moderately polluted | 101–200 | 101–250 | 61–90 |
| Poor | 201–300 | 251–350 | 91–120 |
| Very poor | 301–400 | 351–430 | 121–250 |
| Severe | 401–500 | 430+ | 250+ |
- Sub-indices use 24-hour averages, except 8-hour values for CO and O3.
- Overall AQI needs data for at least three pollutants, one of which must be PM2.5 or PM10.
- A sub-index needs a minimum of 16 hours of data.
- The real-time AQI uses running averages — the 6 am value includes data from 6 am the previous day.
How do sub-indices and gas breakpoints work in the AQI?
Each pollutant's sub-index is a linear function of its concentration within a band. CPCB's own worked example for PM2.5: a 24-hour concentration of 31 µg/m³ gives a sub-index of 51, 45 µg/m³ gives 75, and 60 µg/m³ gives 100. Sub-indices are published for every monitored pollutant even when there are too few pollutants to declare an overall AQI.
| AQI category | NO2 (24 h) | SO2 (24 h) | O3 (8 h) | CO (8 h) |
|---|---|---|---|---|
| Good | 0–40 | 0–40 | 0–50 | 0–1.0 |
| Satisfactory | 41–80 | 41–80 | 51–100 | 1.1–2.0 |
| Moderately polluted | 81–180 | 81–380 | 101–168 | 2.1–10 |
| Poor | 181–280 | 381–800 | 169–208 | 10–17 |
| Very poor | 281–400 | 801–1600 | 209–748 | 17–34 |
| Severe | 400+ | 1600+ | 748+ | 34+ |
Notice how the upper edge of the Satisfactory band matches the national short-term standard for several pollutants: 80 µg/m³ for NO2 and SO2, 100 µg/m³ for PM10 and 8-hour ozone, 60 µg/m³ for PM2.5 and 2 mg/m³ for 8-hour CO. Moving into the Moderately polluted band therefore means the 24-hour (or 8-hour) standard has been crossed.
Why does indoor (household) air pollution matter?
Around 2.1 billion people — about a quarter of the world — still cook on open fires or inefficient stoves fuelled by kerosene, biomass (wood, animal dung, crop waste) and coal. Household air pollution was responsible for an estimated 2.9 million deaths in 2021, including over 309,000 deaths of children under five. In poorly ventilated homes, indoor smoke can contain fine particles 100 times higher than acceptable levels.
| Aspect | Key point |
|---|---|
| Most exposed | Women and children, who spend the most time near the hearth |
| Diseases | Stroke, ischaemic heart disease, COPD and lung cancer; 44% of pneumonia deaths in children under five |
| Urban versus rural reliance on polluting fuels (2021) | 14% urban versus 49% rural |
| Clean alternatives | Solar, electricity, biogas, LPG, natural gas, alcohol fuels, compliant biomass stoves |