What is the cardiac cycle?
StatPearls defines the cardiac cycle as a series of pressure changes within the heart that move blood through the chambers. Depolarisation starts at the SA node, the atria contract together, the impulse pauses briefly at the AV node, and then both ventricles contract together. Mechanical events lag slightly behind electrical ones — on a Wiggers diagram the QRS complex just precedes the rise in ventricular pressure.
Valves make the flow one-way. Because right and left sides behave alike (at very different pressures), the cycle is usually described for the left ventricle.
- Systole = from mitral (and tricuspid) closure to aortic (and pulmonary) closure — ventricular contraction and ejection.
- Diastole = from aortic closure to the next mitral closure — ventricular relaxation and filling.
What are the phases of the cardiac cycle and the valve events?
Ventricular function is divided into four phases: isovolumic contraction, ejection, isovolumic relaxation and filling. Every phase boundary is a valve opening or closing, which happens when the pressure gradient across that valve reverses.
| Phase | Begins with | Valves | What happens |
|---|---|---|---|
| Isovolumic contraction | Mitral closure (S1) | All closed | Pressure rises steeply; volume unchanged |
| Ejection (rapid, then reduced) | Aortic valve opens when LV pressure exceeds aortic pressure | Aortic open, mitral closed | Volume falls from EDV to ESV |
| Isovolumic relaxation | Aortic closure (S2; dicrotic notch) | All closed | Pressure falls steeply; volume unchanged |
| Rapid filling | Mitral valve opens when LV pressure falls below LA pressure | Mitral open, aortic closed | Most filling; S3 if present |
| Diastasis | — | Mitral open | Slow filling, LA and LV pressures nearly equal |
| Atrial systole | P wave | Mitral open | Atrial 'kick' tops up EDV; S4 if present |
| Chamber/vessel | Maximum/minimum |
|---|---|
| Left ventricle | 120/15 |
| Aorta | 120/80 |
| Right ventricle | 25/5 |
| Pulmonary artery / left atrium | 25/10 |
| Right atrium | Mean 4–5 |
How do you read a Wiggers diagram?
A Wiggers diagram stacks, on a common time axis, aortic pressure, left atrial pressure, left-ventricular pressure, ventricular volume, the ECG and the phonocardiogram. Read it vertically: at any moment you can see which valve is open and which sound is produced.

- S1 coincides with the ventricular pressure curve crossing atrial pressure (mitral closure), just after the QRS.
- Aortic valve opens where LV pressure crosses aortic pressure; LV and aortic curves then run together.
- S2 coincides with the incisura (dicrotic notch) of the aortic pressure curve — A2 and P2 fall on the incisurae of the aortic and pulmonary curves.
- Ventricular volume is highest at end-diastole (EDV) and lowest at end-systole (ESV); the drop between them is the stroke volume.
- On the atrial curve, the a wave follows atrial systole (after the P wave), and the c and v waves follow in ventricular systole.
When do the heart sounds occur in the cardiac cycle?
| Sound | Timing | Cause | Exam point |
|---|---|---|---|
| S1 | Start of systole | Mitral and tricuspid closure | Mitral component louder and earlier; split S1 with delayed RV contraction (e.g. RBBB) |
| S2 | Start of diastole | Aortic then pulmonary closure | A2 earlier and louder; physiological inspiratory split |
| S3 | Early diastole (rapid filling) | Filling of a volume-loaded ventricle (mechanism debated) | Low-pitched, apex, left lateral position; can be normal in children and athletes |
| S4 | Late diastole | Atrial contraction against a stiff, non-compliant ventricle | Hallmark of reduced compliance, e.g. LV hypertrophy |
Because the mitral component dominates S1, changes in S1 intensity mostly reflect forces acting on the mitral valve — left-ventricular contractility, mitral valve structure and the PR interval. S2 has been called the 'key to auscultation of the heart' because its two components and their respiratory behaviour orient you to every other sound.
Timing a murmur against S1 and S2 is the first step in auscultation: a murmur between S1 and S2 is systolic (blood leaving the ventricle — aortic stenosis, mitral regurgitation, HOCM); one after S2 is diastolic (blood entering the ventricle — mitral stenosis, aortic regurgitation). See valvular heart disease and murmurs for the full list.
What are the types of splitting of S2?
Normally A2 precedes P2, and the gap widens on inspiration because pulmonary valve closure is delayed (lower pulmonary vascular impedance and more right-sided filling). The two components need more than about 20 ms of separation to be heard as two sounds. A split of more than 0.04 s on expiration is usually abnormal (Clinical Methods).
The mechanism is the 'hangout interval': in the low-impedance pulmonary circulation the pulmonary artery pressure curve lags behind the RV pressure curve by about 30–120 ms, while on the left side the lag is 5 ms or less. Inspiration lowers pulmonary impedance further, prolonging RV ejection and delaying P2, while left-sided ejection shortens slightly and A2 comes a little earlier.
| Pattern | Respiratory behaviour | Classic causes |
|---|---|---|
| Physiological | Split on inspiration, single on expiration | Normal |
| Persistent (wide) splitting | Audible in expiration, still wider on inspiration | RBBB (commonest on standing), pulmonary stenosis, pulmonary hypertension with RV failure, massive PE; early A2 in mitral regurgitation |
| Fixed splitting | No change with respiration | Atrial septal defect (classic) |
| Paradoxical (reversed) splitting | P2 before A2; split on expiration, narrows on inspiration | LBBB (commonest), severe aortic stenosis, HOCM, acute MI, severe LV dysfunction |
What does the left-ventricular pressure-volume loop show?
The PV loop plots LV volume on the x-axis and pressure on the y-axis for one beat, so it runs anticlockwise through the four phases: filling along the bottom (rising volume), isovolumic contraction up the right side, ejection across the top (falling volume) and isovolumic relaxation down the left side.
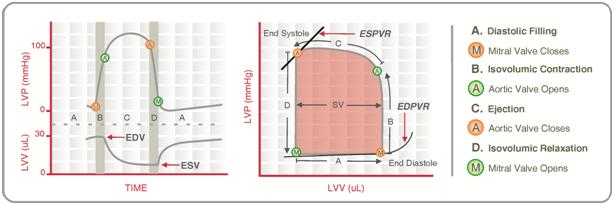
| Feature | Meaning |
|---|---|
| Bottom-right corner | End-diastole: mitral closes; EDV |
| Top-left corner | End-systole: aortic closes; ESV |
| Width | Stroke volume = EDV − ESV |
| Area | Stroke work (a pressure × volume product) |
| Ejection fraction | (EDV − ESV) / EDV |
| ESPVR (end-systolic pressure-volume relation) | Line through end-systolic points; index of contractility |
| EDPVR (end-diastolic pressure-volume relation) | Curve of passive filling; reflects ventricular compliance |
Stroke volume = EDV − ESV; Ejection fraction = (EDV − ESV) ÷ EDV
Ejection fraction is load-dependent and is driven largely by its denominator (EDV), so very different EFs can coexist with similar contractility.
How does the PV loop change with preload, afterload and contractility?
| Change | Effect on the loop | EDV | ESV | Stroke volume |
|---|---|---|---|---|
| ↑ Preload (e.g. IV fluid) | Loop moves right along the EDPVR — wider loop | ↑ | Little change | ↑ (Frank–Starling) |
| ↓ Preload (e.g. haemorrhage, venodilators) | Loop moves left down the EDPVR — narrower | ↓ | Little change | ↓ |
| ↑ Afterload (e.g. hypertension, aortic stenosis) | Ejection occurs at a higher pressure; loop taller and narrower | — (↑ later) | ↑ | ↓ |
| ↑ Contractility (e.g. catecholamines) | ESPVR shifts and rotates left (steeper) | — | ↓ | ↑ |
| ↓ Contractility (e.g. systolic heart failure) | ESPVR flatter; loop shifts right | ↑ | ↑ | ↓ |
StatPearls notes that, with afterload and contractility constant, a rise in preload moves the loop rightward along the EDPVR, increasing EDV and stroke volume, with a slight rise in ejection fraction. Solaro's analysis shows why afterload matters: when blood is ejected into a stiffer, higher-pressure aorta, the sarcomeres shorten less, so ESV rises and stroke volume falls until EDV increases to compensate. An increase in contractility (e.g. β1-adrenergic stimulation) shifts and rotates the ESPVR to the left, so the ventricle empties to a smaller ESV at the same afterload.
On the Frank–Starling curve the same factors appear as curve shifts: catecholamines (more inotropy) or lower afterload shift the curve up; systolic failure, loss of myocardium after infarction, acute β-blockade or higher afterload shift it down.