INICET PSM (Community Medicine) Previous Year Questions (2018–2026)

204 INICET PSM (Community Medicine) PYQs from 2018 to 2026, tagged by topic, with an explanation for every question. Practise AIIMS-pattern PSM (Community Medicine) questions before INICET November 2026.

Last verified: 24 September 2026 against AIIMS New Delhi notices and aiimsexams.ac.in.

Quick Answer

Kinase has 204 INICET PSM (Community Medicine) PYQs from 2018 to 2026 — 6.1% of all INICET PYQs in the bank. The most-asked topic is Epidemiology (64 questions). INICET is marked +1 / −1/3, so a blind guess is worth nothing on average.

PSM (Community Medicine) in INICET at a glance

INICET PSM (Community Medicine) PYQs on Kinase204 (6.1% of all INICET PYQs)
Years covered2018–2026
Marking+1 correct, −1/3 wrong
NEET-PG PSM (Community Medicine) PYQs on Kinase126

Most-asked PSM (Community Medicine) topics in INICET PYQs

TopicINICET PYQsShare of subject
Epidemiology6431%
Epidemiology of Communicable Diseases4120%
Indian Health Programmes3216%
Demography and Health Economics94%
Screening94%

Across NEET PG and INI-CET papers: Most repeated PSM (Community Medicine) topics →

Sample INICET PSM (Community Medicine) PYQs with answers

Question 1 · INICET May 2026

What is the purpose of exploring heterogeneity in a meta-analysis?

  1. A.To assess the risk of bias in the included studies
  2. B.To identify the potential variation between the included studies
  3. C.To determine if the included studies are of high quality
  4. D.To estimate the overall effect size of the meta-analysis
Show answer and explanation

Answer: B. To identify the potential variation between the included studies

The correct answer is To identify the potential variation between the included studies.

Heterogeneity is the variation in results across the studies in a meta-analysis, beyond what is expected from chance. Exploring it identifies and quantifies the between-study variation and its sources (differences in population, intervention, design or outcome). It is measured with Cochran's Q and the I-squared statistic (I2 of 25, 50 and 75 percent for low, moderate and high heterogeneity). Substantial heterogeneity calls for a random-effects model and subgroup or sensitivity analysis.

The other options are different steps. Assessing risk of bias and judging study quality are critical-appraisal tasks, and estimating the pooled effect size is the main result of the meta-analysis - not the purpose of exploring heterogeneity.

Incorrect Options:

  • To assess the risk of bias in the included studies: that is risk-of-bias appraisal, a separate step.
  • To determine if the included studies are of high quality: that is quality appraisal, not heterogeneity.
  • To estimate the overall effect size of the meta-analysis: that is the pooled estimate, the main output, not the aim of heterogeneity assessment.

High-Yield Facts:

  • Heterogeneity = between-study variation in results beyond chance.
  • Quantified by Cochran's Q and I-squared (25, 50, 75 percent = low, moderate, high).
  • High heterogeneity means a random-effects model is used.
  • Explore sources via subgroup and sensitivity analyses.
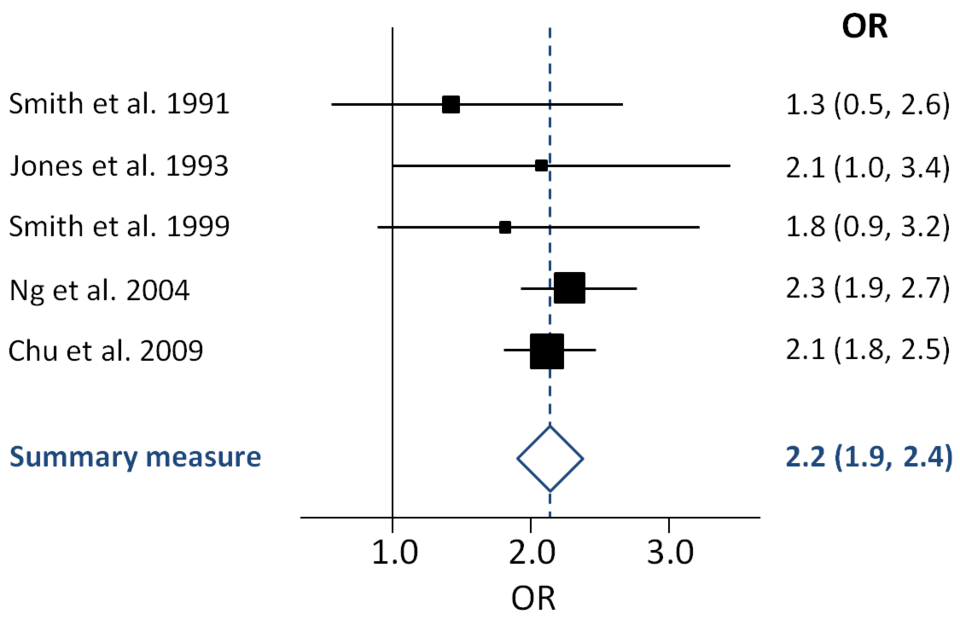
Generic forest plot showing individual study odds
  ratios and a pooled summary measure

Figure 1: A forest plot - the spread of individual study estimates around the pooled summary reflects heterogeneity.
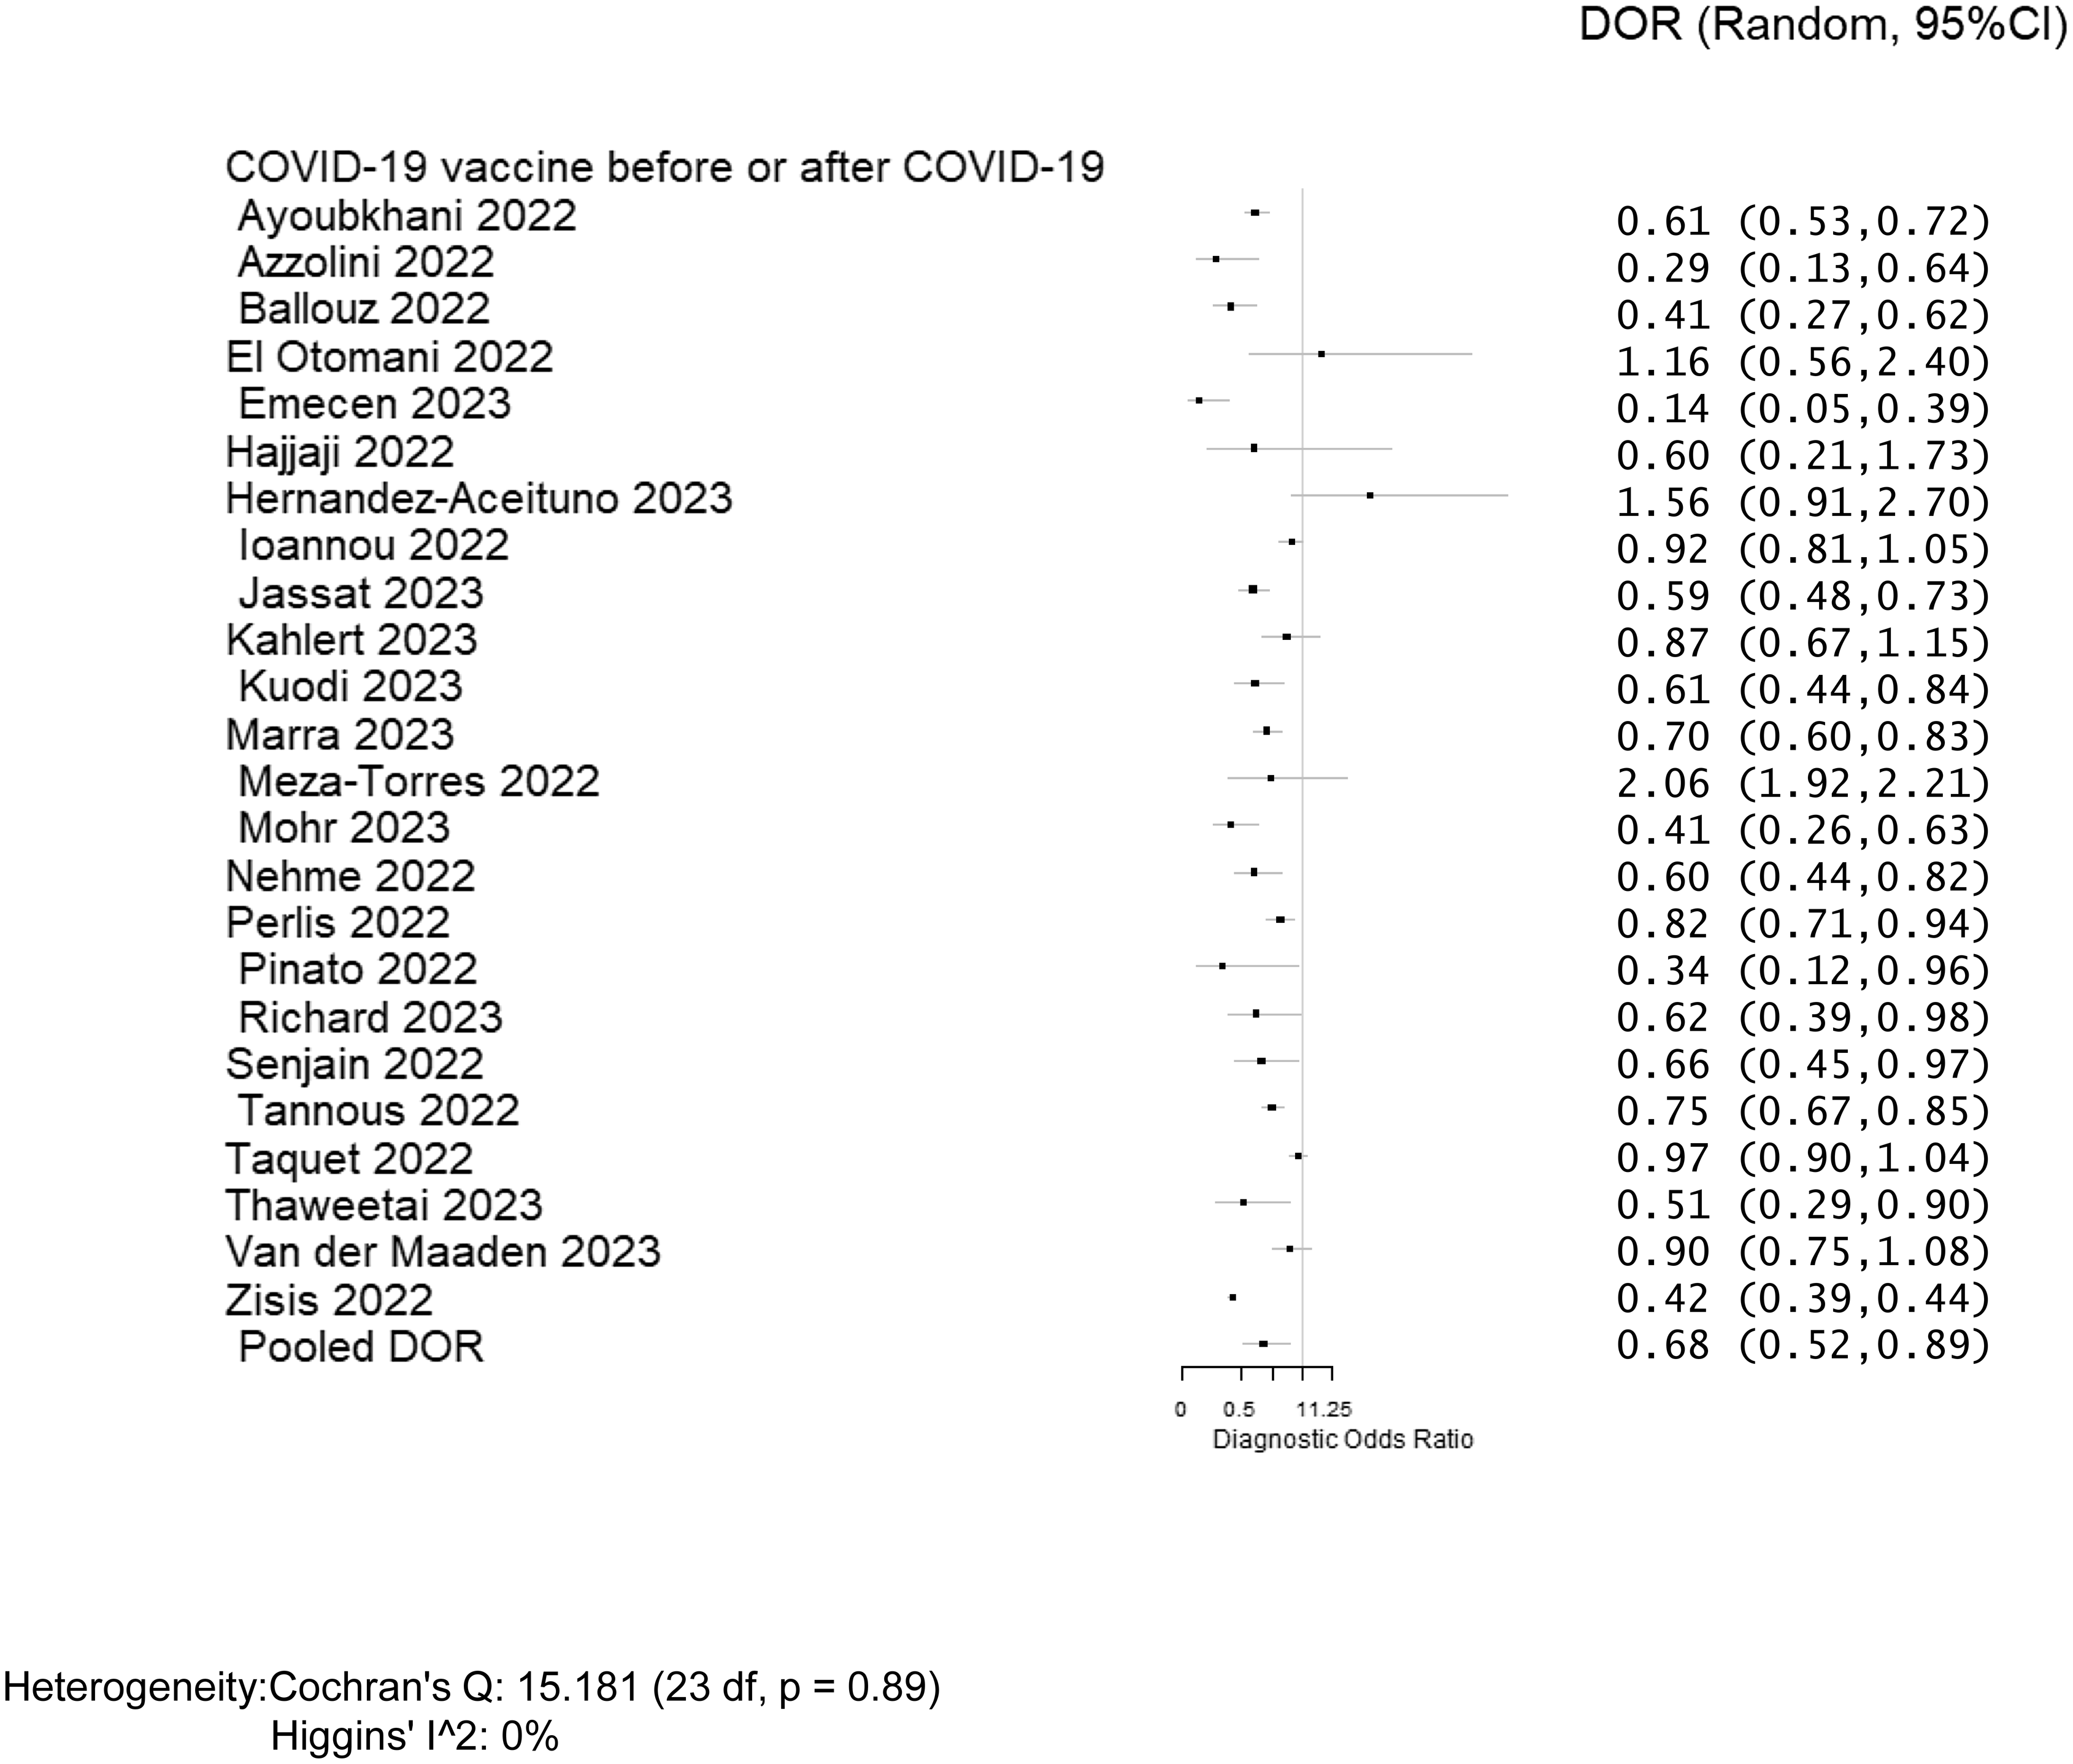
Real forest plot of a
  meta-analysis reporting Cochran Q and Higgins I-squared heterogeneity statistics

Figure 2: A real meta-analysis forest plot reporting heterogeneity as Cochran's Q and Higgins' I-squared at the bottom.
Question 2 · INICET May 2026

Assertion (A): Nested case-control studies can precisely estimate the relative risk.
Reason (R): They use incidence data from the cohort.

  1. A.A is true, but R is false
  2. B.Both A and R are true, and R is the correct explanation of A
  3. C.A is false, but R is true
  4. D.Both A and R are true, but R is not the correct explanation of A
Show answer and explanation

Answer: B. Both A and R are true, and R is the correct explanation of A

The correct answer is Both A and R are true, and R is the correct explanation of A.

A nested case-control study is carried out within an existing cohort: the cases that arise are compared with controls sampled from those still at risk when each case occurs (incidence-density sampling). Because cases and controls come from a defined cohort with known follow-up and incidence data, the odds ratio obtained directly estimates the relative risk (rate ratio) - without needing the rare-disease assumption of an ordinary case-control study. So A is true, and R (use of cohort incidence data) is precisely why this is possible, so R correctly explains A.

An ordinary case-control study lacks a defined denominator, so it can only approximate the relative risk through the odds ratio. The nested design keeps the efficiency of case-control sampling while gaining the cohort's ability to estimate risk.

Incorrect Options:

  • A is true, but R is false: R is actually true and is the reason A holds.
  • A is false, but R is true: A is true - nested case-control can estimate relative risk.
  • Both A and R are true, but R is not the correct explanation of A: R is in fact the correct explanation.

High-Yield Facts:

  • Nested case-control is done within a cohort and uses its incidence data.
  • Incidence-density sampling lets it estimate the relative risk or rate ratio.
  • It is more efficient and cheaper than analysing the whole cohort.
  • Ordinary case-control gives only an odds ratio (approximates RR if disease is rare).
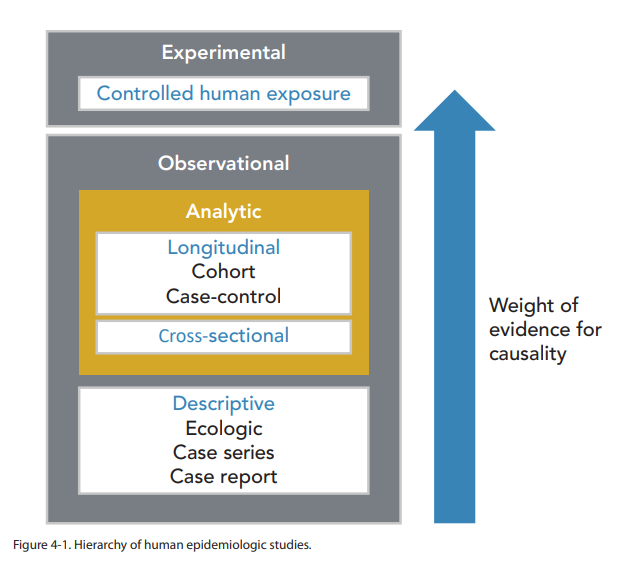
Hierarchy of epidemiological studies with case-control under analytic
  observational designs

Figure 1: Hierarchy of epidemiological study designs - case-control is an analytic observational design.

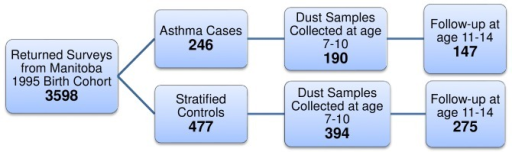
Flow diagram of a nested case-control study with cases and controls drawn from a
  birth cohort

Figure 2: A nested case-control study - cases and sampled controls are drawn from within a defined cohort, so its incidence data allow estimation of relative risk.

Question 3 · INICET May 2026

In a population of 1000 people, 100 have an early-stage disease. A new test correctly detects 90 of them and also flags 50 disease-free people as false positives. What is the positive predictive value of the test?

  1. A.85.20%
  2. B.64.50%
  3. C.15%
  4. D.90%
Show answer and explanation

Answer: B. 64.50%

The correct answer is 64.50%.

The positive predictive value (PPV) is the probability that a person who tests positive truly has the disease: PPV = TP / (TP + FP). Build the 2x2 table from the data. Of the 100 diseased people the test detects 90 (so TP = 90, FN = 10), and among the 900 disease-free people it wrongly flags 50 (FP = 50, TN = 850). The total testing positive is TP + FP = 90 + 50 = 140. Therefore PPV = 90 / 140 = 0.643, i.e. about 64.3 percent - the closest option is 64.5%.

PPV is not an intrinsic property of the test - it falls as disease prevalence falls, because more false positives arise relative to true positives, unlike sensitivity and specificity which are fixed test characteristics. Here the sensitivity is 90/100 = 90 percent, yet the PPV is only about 64 percent because the disease is uncommon. For completeness, the negative predictive value is TN/(TN+FN) = 850/860, about 99 percent.

Incorrect Options:

  • 90%: that is the sensitivity, TP/(TP+FN) = 90/100, not the PPV.
  • 85.20%: does not correspond to any standard test index for these numbers.
  • 15%: far too low - it would imply most positives are false, which is not the case here.

High-Yield Facts:

  • PPV = TP / (TP + FP) - here 90/140 = about 64.3 percent.
  • Sensitivity = TP/(TP+FN) = 90 percent, a fixed test property.
  • PPV rises with prevalence, and NPV falls with prevalence.
  • Sensitivity and specificity are independent of prevalence.
Diagram
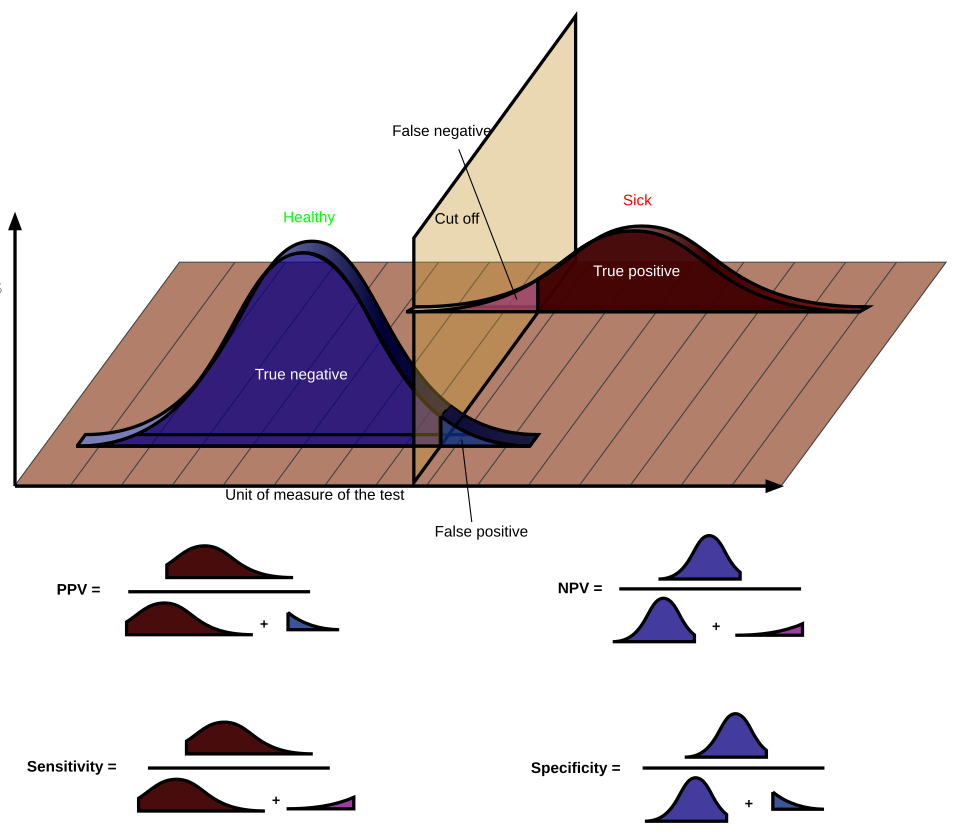
  showing TP, FP, FN, TN with PPV, NPV, sensitivity and specificity formulas

Figure 1: PPV = true positives / all positives (TP + FP).

Graphs
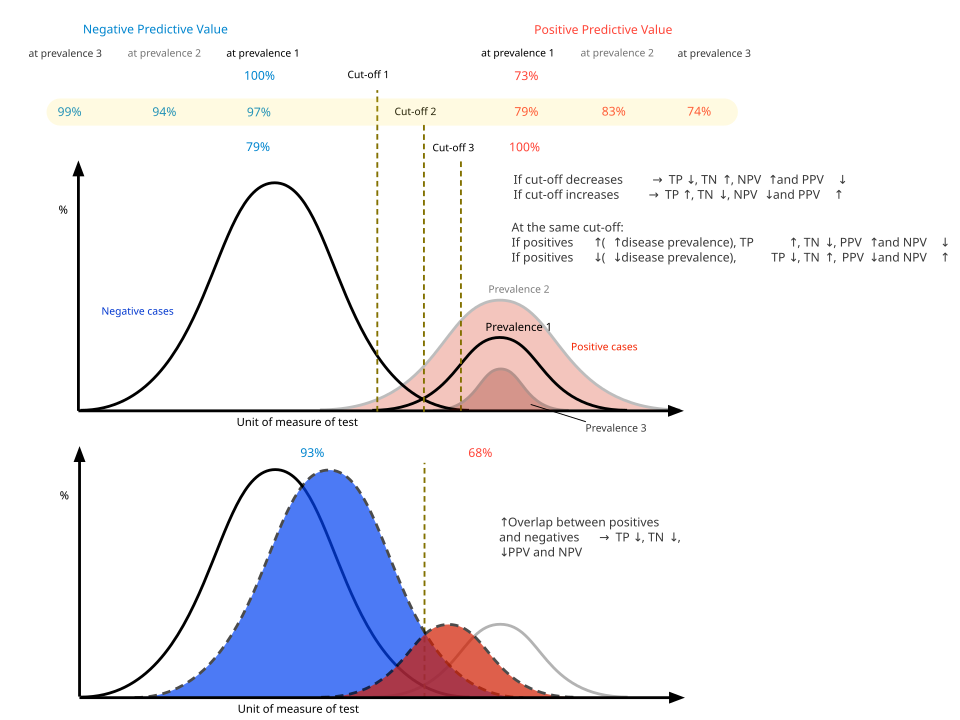
  showing how PPV and NPV change with disease prevalence and cut-off

Figure 2: PPV and NPV change with prevalence; sensitivity and specificity do not.

PSM (Community Medicine) concept guides

Browse the full concept library and clinical image atlas.

Practise the rest: open the Kinase question bank, choose PSM (Community Medicine), set the exam to INICET and switch on PYQs only. Build 50-question custom tests to rehearse one 45-minute INICET section.

Frequently Asked Questions

How many INICET PSM (Community Medicine) PYQs does Kinase have?▼
Kinase has 204 INICET PSM (Community Medicine) previous year questions from 2018 to 2026, each with an explanation — 6.1% of all INICET PYQs in the bank. There are also 126 NEET-PG PSM (Community Medicine) PYQs for extra practice.
What are the most-asked PSM (Community Medicine) topics in INICET?▼
In Kinase's INICET PSM (Community Medicine) PYQs, the most-asked topics are Epidemiology, Epidemiology of Communicable Diseases, Indian Health Programmes. Epidemiology alone accounts for 64 of the 204 questions.
How is INICET PSM (Community Medicine) marked?▼
Like every INICET subject, PSM (Community Medicine) questions are +1 for a correct answer and −1/3 for a wrong one. INICET has 200 MCQs in four 45-minute sections of 50, for 200 marks.
Are INICET PSM (Community Medicine) PYQs different from NEET-PG?▼
Both exams test the MBBS syllabus, so most PSM (Community Medicine) concepts overlap. INICET is conducted by AIIMS New Delhi twice a year and marked +1 / −1/3; NEET-PG is conducted by NBEMS once a year and marked +4 / −1.
When is the next INICET?▼
INICET November 2026 is on 1 November 2026, with registration from 16 September to 13 October 2026 on aiimsexams.ac.in.
204 PSM (Community Medicine) PYQs
2018–2026 papers
Topic + year tagged

Ready to Start Practicing?

INICET November 2026 is on 1 November — registration closes 13 October.

Start Free Practice

No credit card required